
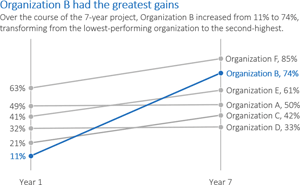
Data visualization basically comes down to two techniques: simplification and emphasis.
This article illustrates the techniques via an example:
- Simplify the graph: Remove the border, horizontal grid lines, vertical axis, legend, title, and the color!
- Emphasize your message with text: Add direct labels, a descriptive title, and a descriptive subtitle. Make sure the text is hierarchical.
- Emphasize your message with color: Match your graph's color palette to your organization's logo.
Full article: The simplification and emphasis approach to editing graphs
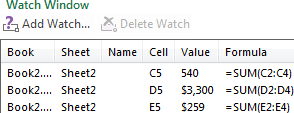
In this tutorial, you will learn a few quick and efficient ways to check and debug formulas in Excel:
- Use F2 to edit Excel formulas.
- Use F9 to evaluate and debug formula parts.
- Debug a formula by using the Evaluate Formula feature.
- Highlight and match parenthesis pairs in Excel formulas.
- Highlight all cells a given formula refers to.
- Highlight all formulas that reference a given cell.
- Trace formula relationships in Excel (Trace Precedents and Trace Dependents).
- Monitor formulas and their calculated values (Watch Window).
Full article: How to edit, evaluate and debug formulas in Excel

There are a few rules for model design that should be followed when designing the layout of a model. Most experienced modellers will follow these instinctively, as they are generally common sense:
- Separate inputs, calculations, and results, where possible.
- Use each column for the same purpose.
- Use one formula per row or column.
- Refer to the left and above.
- Use multiple worksheets.
- Include documentation sheets.
- Design issues: time series, data collection, model purpose, and model audience.
Full article: The golden rules for model design
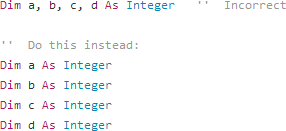
Coders have long banned Hungarian notation from their VBA modules. It's meaningless when the code editor is slick enough to show information about a variable.
But now a new crop of equally meaningless, over-used coding errors have begun to litter code modules... and these need to go, too:
- Hungarian notation.
- Long
SubandFunctionprocedures. - Meaningless naming of variables and procedures.
- Using error handlers, just for the sake of it.
- Using comments, just for the sake of it.
- Not validating data.
- Too many parameters.
- Using magic values.
- Declaring variables incorrectly.
- Coding more than you have to.
Full article: Ten useless VBA coding errors that must be terminated

The VBA Like operator is something so useful I am often surprised how rarely it is used in Excel and Access VBA.
I often tend to see the Like operator as the last resort before using Regular Expressions in VBA. It replaces greatly the VBA InStr function when needing to check if a certain substring is present within a certain string.
The main take-aways are:
- Use the VBA
Likeinstead of theInStrfunction to check if a string contains a substring. - Consider using the VBA
Likebefore resorting to VBA Regular Expressions. - Be sure to master string manipulation too!
Full article: VBA Like operator – using wildcards in conditional statements
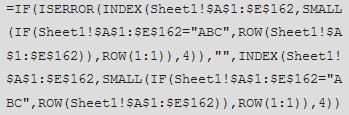
There comes a time in many Excel users' careers where we start to write incredibly complex Excel formulas to summarise or extract data from poorly structured workbooks.
The true Excel Guru knows that if the data were in a tabular format we'd be able to use the amazing tools Excel has available. Tools that make mincemeat of complex formulas.
So, next time you're faced with a complicated formula you should ask yourself if changing the layout of the workbook could be the solution instead of writing a mind bending formula that is likely to end up broken the minute a less experienced Excel user tries to edit it.
Full article: Avoid writing complex Excel formulas
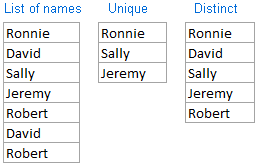
In this tutorial you will learn how to count unique values in Excel with formulas, and how to get an automatic count of distinct values in a pivot table.
We will also discuss a number of formula examples for counting unique names, texts, numbers, case-sensitive unique values, and more.
Specifically:
- Count unique values in a column.
- Count unique text values.
- Count unique numbers.
- Count case-sensitive unique values.
- Count distinct values ignoring blank cells.
- Formula to count distinct text values.
- Formula to count distinct numbers.
- Counting case-sensitive distinct values.
- How to count unique and distinct rows in Excel.
- Automatic count of distinct values in a pivot table.
Full article: How to count distinct and unique values in Excel
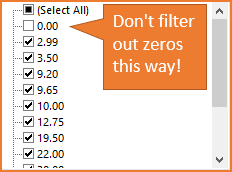
Often times we are working with a list or data set that contains a lot of zeros in a column. We might want to filter these zeros out to shorten the list, so that we only see numbers that are greater than or less than zero. One easy way to do this is to uncheck the zero (0) item in the filter drop-down box.
However, this can produce unexpected results. Learn the correct way to filter out zeros and numbers with the filter drop-down menus in Excel, and avoid embarrassing mistakes.
Full article: How to properly filter zeros and numbers with the Filter drop-down menus
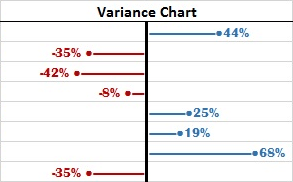
Whether it is in daily life or at work, we are always making comparisons to see what's good and what is not so good. This differential analysis is called variance analysis.
Here are 10 techniques to take variance analysis beyond simple numbers and percentages:
- Use brackets for negative numbers.
- Color the content or data – custom number format.
- Use arrows.
- Use cell color.
- Use arrows – Conditional Formatting.
- Use data bars.
- "In-cell" charts.
- Use scaled-down actual charts.
- Make better variance charts.
- Highlight instances in chart.
Full article: 10 ways to present variance analysis reports in Excel