
This article presents an overview of recommended Excel modeling best practices:
- Use a simplified SDLC for spreadsheets.
- Use a simplified Version Control process.
- Focus on reducing points of failure.
- Reuse pretested standard formulas and templates.
- Use self-documenting formulas.
- Use tool-tip documentation.
- Reduce data entry errors.
Full article: Modeling best practices
Transparency is important to auditors and to those who commission models because the less transparent a model is the longer it takes to audit and the more it costs to deliver.
I have never seen a 'transparency' measure yet modelers claim one method is more transparent than another. How do they know? The short answer is, they don't because no one, that I know of, measures model transparency.
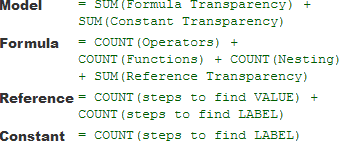
This article proposes a metric for Excel model transparency. A model's transparency is the sum of components for:
- Constants. To measure a constant's transparency we count the minimum number of steps required to find its LABEL (meaning).
- References. To measure a reference's transparency we count the minimum number of steps required to find its VALUE and LABEL.
- Formulas. To understand any formula we must understand its references, its operators, and its functions.
Full article: Transparency measures in Excel
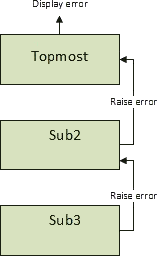
This post provides a complete guide to VBA error handling.
Topics covered include:
- VBA errors.
- The
On Errorstatement. - The
Errobject. - Logging.
- Error function and error statement.
- A simple error handling strategy.
- A complete error handling strategy.
Full article: VBA error handling – A complete guide
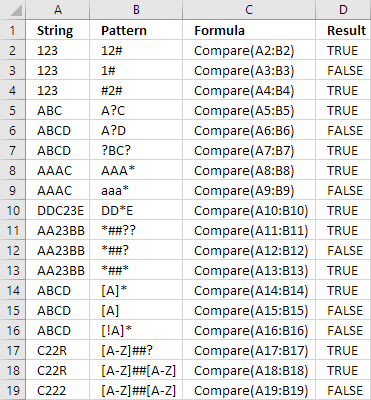
The Like operator allows you to match a string to a pattern in Excel VBA.
This blog describes usage of the VBA Like operator and, as a bonus, mentions how you can use the question mark ? and asterisk * for pattern matching in many Excel functions
The VBA Like operator uses the following patterns:
?(question mark) - Matches any single character.*(asterisk) - Matches zero or more characters.#(number or hash sign) - Any single digit.[abc]- Characters enclosed in brackets allows you to match any single character in the string.[!abc]- The exclamation mark (!) matches any single character not in the string.[A-Z]- The hyphen lets you specify a range of characters.
Full article: Like operator
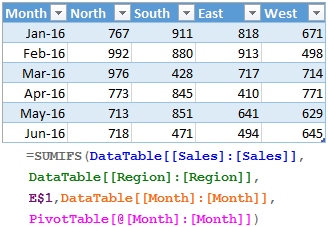
One of the most powerful features of Excel formulas is the ability to create absolute references that don't move around when you drag to extend cell formulas or copy them to different places in your spreadsheet.
When you start using data tables in Excel, many users are frustrated to discover that the normal methods for freezing the row or column references don't work! This can make it time consuming to build your spreadsheets when they use tables.
Fortunately, there are some workarounds! We'll walk through a few of them in this quick tutorial.
Full article: How to lock cell formula references for table columns in Excel
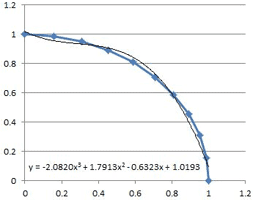
A frequent question on internet forums everywhere is how to do a least squares fit of a non-linear trend line to a set of data.
The most frequent answer is to plot the data on an XY (“scatter”) chart, and then use the "Fit Trendline" option, with the "display equation on chart" box checked. The chart trendlines have the options of: Linear, Exponential, Logarithmic, Polynomial (up to order 6), and Power. There is also a "Moving Average" option, but this does not provide a trendline equation.
The chart trendline solution is OK if what you want to do is display the trendline equation on a chart, but if you want to use the numbers in some further analysis, or even just display them elsewhere in the spreadsheet, or copy them to another document, it is far from convenient. Fortunately it is straightforward to get the trendline equations (and other statistics) for each of the chart trendline types using the LINEST worksheet function.
Full article: Using LINEST for non-linear curve fitting
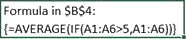
With Excel 2013, Microsoft introduced several new functions, one of which is worth a separate mention. FORMULATEXT displays as text the formula in a cell.
Full article: The Excel FORMULATEXT function
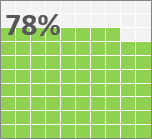
I've been toying around with Excel Waffle charts (sometimes called Square Pie Charts). It's an interesting visualization that I've recently used to display progress toward goal.
In this post, I'll walk you through the steps to set up a waffle chart template and how to duplicate it for as many metrics as you need.
Full article: Not available
The next time you notice something being done in Excel where you work, take a moment to question whether it's the right tool for the job, or whether you or someone in your organisation is a tool for allowing its use.
No, not my words, but from the FT's consistently excellent Alphaville blog. The point is, it's easy to use Excel. But it's very hard to use Excel well.
Full article: The right tool?