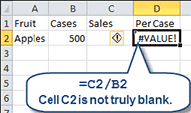
It's a frustrating experience when a simple Excel spreadsheet displays #VALUE! in a worksheet cell rather than the expected result. Many times the problem is obvious, in that you've tried to do arithmetic using text and numbers, but sometimes the culprit is harder to track down.
Full article: Not available
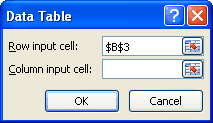
In many situations, we are interested in tabulating the results of a calculation by changing one or more variables involved in the calculation. As an example, consider that you are thinking of getting a loan for your automobile purchase. You are not sure about loan period; whether to go for a 48 months loan or for a 60 months loan.
It would be nice if Excel can produce a table of monthly payments for a range of loan periods to help you in your decision. The data table feature of Excel does exactly that.
Full article: Data tables
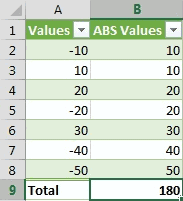
A colleague of mine asked me today how to go about using MS Excel formulas to calculate the sum of absolute values from a given dataset. This question crops up quite often on the forums so I thought I'd put together a quick blog post on it.
There isn't a built-in SUMABS() (or equivalent) worksheet function so you have to do a little bit of work to get the right answer.
Three options:
- Use a helper column.
- Use a
SUM()array formula orSUMPRODUCT(). - Use
SUMIF().
Full article: Calculate the absolute sum in Excel
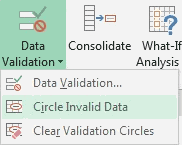
In my blog Using Data Validation to Control Data Entry we looked at how to set up DATA VALIDATION rules, add prompts and customise alert messages. Now, let's look at a few other features you might want to use when working with VALIDATION rules:
- Finding cells that have DATA VALIDATION rules applied.
- Checking for data that no longer meets your rules.
- Preventing duplicate entries.
Full article: Excel - Data Validation error checking & other useful tips
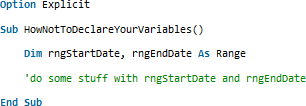
For today's post I'd like you to imagine that you're an up and coming VBA programmer who is starting to feel at home with the IDE and language.
You've read about some VBA best practices which has made you aware of the benefits of Option Explicit, so you've started to dutifully declare your variables and you try to carefully choose what types they should be.
Good on you, but be warned: you're a prime candidate for falling foul of one of VBA's syntactical nuances!
Also see VBA: What type are your constants?
Full article: A common mistake when declaring variables in VBA

My unscientific observation is that the SUM function is the most widely used function within Excel spreadsheets. This function makes it easy to add up multiple cells at once without laboriously adding multiple cells together individually.
Taking things a step further, the AutoSum feature makes it easy to instantly add multiple totals into a spreadsheet. However, such ease of use actually introduces risk into Excel spreadsheets.
Full article: Not available

A Waterfall Chart is a great way to present data when looking at the incremental contribution of individual elements in reaching from one milestone to the other.
Let's take an example below. The left most column shows the total sales for last year, the right most shows the total sales for current year and the segments in between show the incremental contribution of each region in current year over last year. The reds show a negative contribution and the greens show a positive one.
Now let's learn how to make this chart.
Full article: Custom charts in Excel: Waterfall chart
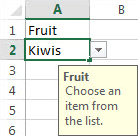
Let's first take a look at the Data Validation feature. On the first worksheet of the workbook where you created your list, click on cell A1 and type the word Fruit. Next, select cell B1 and choose Data and then Data Validation. On the Settings tab, choose List in the Allow field. When the Source field appears, type an equal sign along with the range name that you assigned before, such as =Fruit.
Full article: Not available
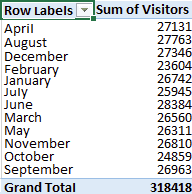
Here is our problem. When you create a Pivot Table in Excel that has a date field, you can Group that field by month and the sort will be logical (January, February, …). But when you create a Pivot Table based on Power Pivot, the grouping does not work!
So you have to get to the month names and a correct sorting by using a different path. We do this by using the Format function in PowerPivot, but the problem is that when you put this field in a Pivot Table, it gets sorted alphabetically. This is logical since the values are text and have nothing to do with dates as far as that Pivot Table is concerned, but this is a problem since the months are not sorted chronologically. This article will tell you how to achieve that.
Full article: Sorting months chronologically and not alphabetically in a Pivot Table report based on Power Pivot data
