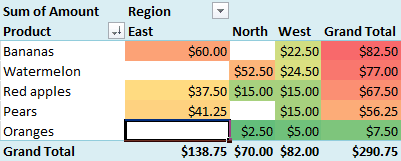
PivotTables in Excel are pretty awesome. In just a few clicks, you can build a detailed report that gives you quick and important insights into your data.
If you polish your PivotTables in the right way, your data and associated reports will be so much more valuable to your friends, colleagues or your manager.
In this post you'll get a wide range of tips to improve your PivotTables, including various shortcuts and hints that may have never heard about:
- Refresh your data source (to ensure your report is correct).
- Disable AutoFit Column Widths.
- Sort your data to answer the real questions.
- How should blank cells be presented?
- Change Subtotal options.
- Group dates together (by Week, Month, Quarter, Year…).
- Show values as a percentage or rank.
- Apply a Style to your PivotTable to align with your branding.
- Support your PivotTable with a PivotChart.
- Analyse relevant data in detail by double-clicking a cell.
- Add Slicers to enable quick filtering.
Full article: Polish your PivotTables with these excellent tips
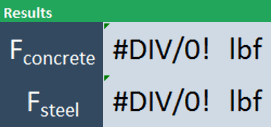
Excel has built-in tools that are very useful for troubleshooting formulas, even if the formulas are complex:
- Trace Precedents.
- Evaluate Formula.
The Evaluate Formula window and the tracer arrows are great tools that can be used to help you find the reason for an error.
Full article: Two quick ways to troubleshoot broken Excel formulas
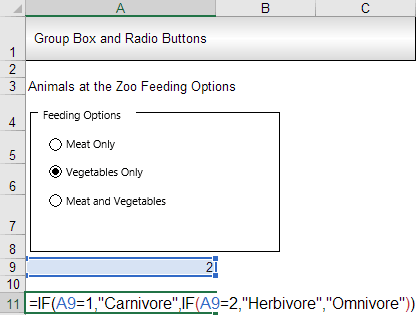
You can give your worksheets form-like functionality without ever having to use VBA. In order to achieve this, you will have to use form controls.
Using formulas in combination with form controls, one can further extend the form control functionality and form-like appearance of the worksheet at hand.
This article uses a few simple examples to illustrate how to use form controls in Excel.
Full article: How to use form controls in Excel
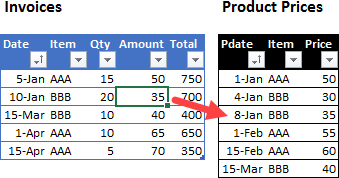
This article describes several alternative approaches to solving a lookup problem in Excel.
Specifically, the problem is: given an on-going list of invoices, create a lookup formula to find the product price based on the invoice date.
Also have a look at the article's comments, where readers propose additional solutions.
Full article: Excel price lookup for date and product name
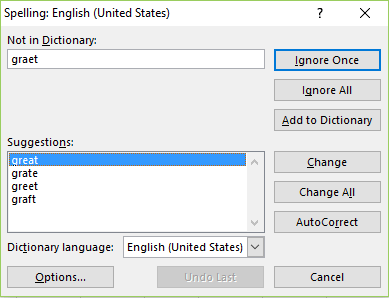
Data cleaning is one of the necessary excel skills that you are expected to possess today.
A data set might be having certain inconsistencies, and to make it more presentable and to help proper understanding of the data it is necessary to make the data look better and error-free.
This article describes 11 techniques to help you 'clean' data in Excel:
- Run a spell check.
- Make the text case consistent.
- Remove any extra spaces.
- Clear all formatting, comments, hyperlinks.
- Treat cells containing errors.
- Use 'Find and Replace' feature to make data look better.
- Replace or substitute text.
- Replace blank cells with '0', 'No Value', 'Nothing', 'Not Available', etc.
- Treat duplicates.
- Merging contents of columns.
- Splitting contents of a column.
Full article: Ultimate guide to data cleaning in Excel
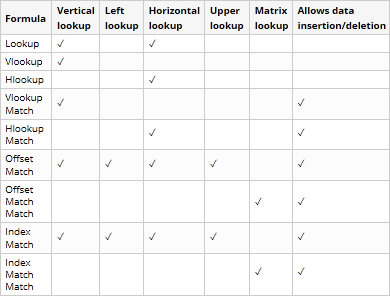
The tutorial explains the basics of lookup in Excel, shows the strengths and weaknesses of each Excel lookup function and provides a number of examples to help you decide which lookup formula is best to be used in a particular situation.
The lookup functions discussed are:
LOOKUP.VLOOKUP.HLOOKUP.VLOOKUP MATCH.HLOOKUP MATCH.OFFSET MATCH.OFFSET MATCH MATCH.INDEX MATCH.INDEX MATCH MATCH.
Full article: Lookup in Excel: Functions and formula examples
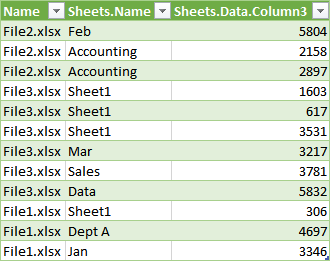
This article explains how to consolidate data from numerous Excel files using Power Query.
The situation:
- A folder contains hundreds of Excel files.
- New workbooks can be added to the folder, or some workbooks can be removed.
- Workbooks do not contain the same number of worksheets.
- Worksheets may be added or removed at any time.
- There is no naming convention for the worksheets.
- Each worksheet may contain one or more values to retrieve.
- The data needs to be consolidated often.
The solution: Use Power Query to import and consolidate the data automatically.
Full article: Retrieve values from many workbooks

This tutorial explains the basics of the Excel HYPERLINK function and provides a few tips and formula examples to use it most efficiently.
Topics include:
- Excel
HYPERLINKfunction - syntax and basic uses. - How to use
HYPERLINKin Excel - formula examples. - Create hyperlinks to different items.
VLOOKUPand insert a hyperlink to the first match.- How to edit multiple
HYPERLINKformulas at a time. - Excel
HYPERLINKnot working - reasons and solutions.
Full article: How to use Excel Hyperlink function to create different link types
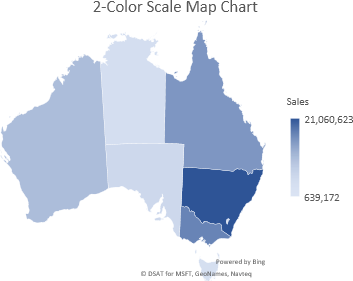
New in Excel 2016 (for Office 365 subscription users only) are Map Charts.
Excel map charts can display your data encoded by:
- Values with a 2-color scale.
- Values with a 3-colour diverging scale.
- By category.
This article shows some examples of how to create and format Excel map charts.
Full article: Excel map charts
