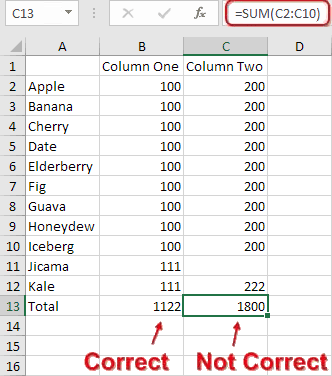
This article explores a pitfall of using Excel's AutoSum feature.
When not used according to Excel's arcane set of rules, everything may appear okay but you can easily introduce an error where some values are omitted from the AutoSum.
A workaround is also suggested, to ensure that AutoSum continues working as expected.
Full article: Problem with two AutoSum columns
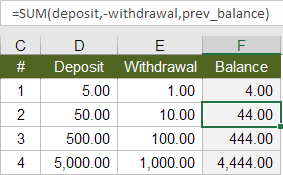
Calculating a running balance is a common and important spreadsheet task.
But inserting rows, deleting rows, and moving rows via cut and paste can introduce hard-to-detect errors in a running balance formula.
This article explains the problems with the basic running balance formula and provides two robust solutions.
Full article: Create a running balance in Excel that allows you to insert, delete, and move rows
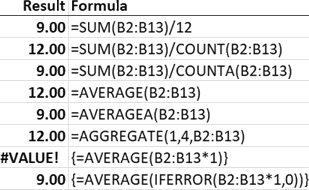
AVERAGE is one of those easy functions in Excel. Like, super easy! It has just one argument, the cells, or numbers to be averaged.
So what's the problem? It's too easy to get wrong, yet we might not notice for weeks, months, years or ever.
There are many ways to calculate an average. Different formulas will fit with different datasets and scenarios. The critical thing is to know your data and exactly what you want to achieve.
Full article: Excel’s AVERAGE function – the hidden pitfalls
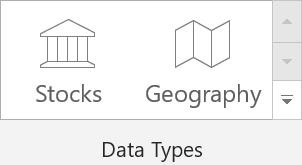
For more than 30 years, Excel's data types have been very basic: text, numbers, Booleans, and dates. The user had to assign meaning to the data, which often leads to errors.
But that is starting to change. Microsoft has introduced the concept of linked data types into Excel. The first two linked data types are Geography and Stocks.
This article describes the new data types, with examples of how to use them.
The new data types are being rolled out to Office 365 users this month.
Full article: Preview of Stocks and Geography, new data types in Excel
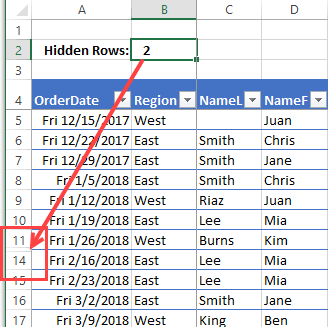
Have you seen the articles that blame Excel for all kinds of business errors?
In some cases, problems occur because rows were hidden, and that distorted the data analysis.
To help avoid those problems, I created a sample file that shows an Excel hidden data warning, if rows or columns are hidden.
Remember, as the old saying goes, it's better to be safe, than to read about your catastrophic errors on the internet.
Full article: Excel hidden data warning
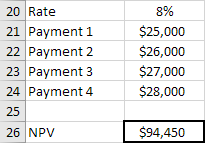
This article provides example scenarios and explains various approaches for calculating the time value of money using Microsoft Excel.
The functions discussed include FV, FVSCHEDULE, PV, NPV, PMT, RATE, and NPER.
For more information, also see Pitfalls of Excel's NPV function.
Full article: Factoring in the time value of money with Excel
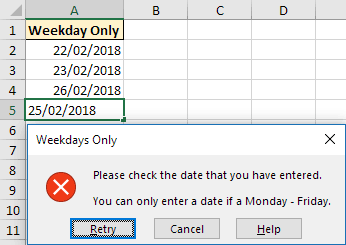
Data Validation is a very useful Excel tool. It controls what can be input into a cell, to ensure its accuracy and consistency.
In this blog post we will explore 11 useful examples of what Data Validation can do:
- Allow uppercase entries only.
- Prevent future dates.
- Creating drop down lists.
- Dependent drop down lists.
- Prevent duplicate values.
- Allow only numeric or text entries.
- Validate an entry based on another cell.
- Allow the entry of weekdays only.
- Restrict the text length.
- Entries contain specific text.
- Create meaningful error messages.
Full article: 11 awesome examples of Data Validation
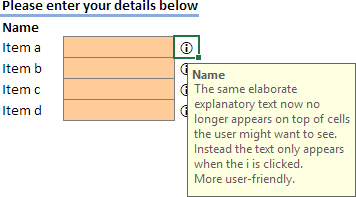
Data Validation is a useful way to provide help for users when they're filling in a data entry form.
But the Data Validation popup message covers the remaining input cells and is very distracting, especially if the form contains many cells to fill. And it cannot be dismissed.
This article describes a technique for adding help using an information icon 🛈 with hyperlink and Data Validation message.
Full article: Creating user-friendly Data Validation in Excel: Displaying help out of the way
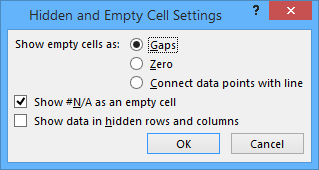
A common problem around web forums and blogs is how to plot blank cells in Excel charts.
There is a lot of confusion about plotting of hidden and empty cells, about what constitutes a blank cell, and about various workarounds that purport to produce blank cells that will or will not be displayed in a chart.
A new feature in Excel 2016, Show #N/A as an empty cell, solves the pain and frustration experienced by generations of Excel users trying to avoid plotting what look like apparently blank cells.
Full article: Plot blank cells and #N/A in Excel charts
