The easiest and highest impact way to implement coding standards is to adopt a disciplined way of naming VBA variables. What follows is SpreadSheet SuperStar's variable naming rules:
- Use
Dimstatement to declare all VBA variables. - Use
Option Explicitin all VBA modules. - Assign every VBA variable a data type.
- Name VBA variables with descriptive names.
- Use data type prefixes for each VBA variable.
- One variable declaration per line of code.
- Declare all variables at the top of each subroutine.
- Style points: Order variables declarations by size.
Full article: Not available
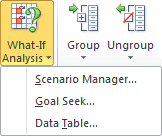
The following are the top 5 Excel features I use on a constant basis to get the most out of my data:
- What-If analysis.
- Sparklines.
- Conditional formatting.
- Format as table.
- PivotTables.
Full article: 5 underutilized Excel features to take advantage of

In Office 2013 there are now 5 features designed to help you manage the use of Excel spreadsheets, including 2 new server-based applications:
- Audit and Control Management Server (new).
- Discovery and Risk Assessment (new).
- Spreadsheet Inquire.
- Spreadsheet Compare.
- Database Compare.
Full article: Not available

In this article, I'll demonstrate how you can use conditional formatting to identify all unlocked cells within a worksheet range. This can serve both as an input aid, so that users know which cells they can affect, as well as an auditing tool, so that you know which cells are protected and which aren't.
Full article: Use conditional formatting to identify unlocked cells
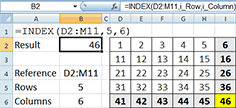
The Excel INDEX function returns the value of a cell. The INDEX function is often confused with the Excel OFFSET Function. The INDEX function is part of a larger group of Excel lookup functions which includes MATCH, VLOOKUP and HLOOKUP.
In this tutorial we will explore the INDEX function and how it compares to the OFFSET function and potential errors that can occur when using this function.
Full article: Not available
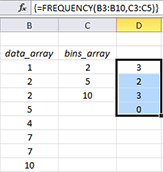
FREQUENCY(data_array, bins_array)
Calculates how often values occur within a range of values and then returns a vertical array of numbers having one more element than the bins_array:
data_array- is an array of or reference to a set of values for which you want to count frequencies.bins_array- is an array of or reference to intervals into which you want to group the values in thedata_array.
Full article: How to use FREQUENCY function
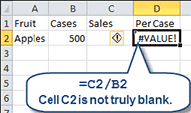
It's a frustrating experience when a simple Excel spreadsheet displays #VALUE! in a worksheet cell rather than the expected result. Many times the problem is obvious, in that you've tried to do arithmetic using text and numbers, but sometimes the culprit is harder to track down.
Full article: Not available
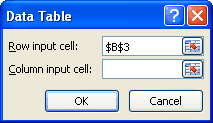
In many situations, we are interested in tabulating the results of a calculation by changing one or more variables involved in the calculation. As an example, consider that you are thinking of getting a loan for your automobile purchase. You are not sure about loan period; whether to go for a 48 months loan or for a 60 months loan.
It would be nice if Excel can produce a table of monthly payments for a range of loan periods to help you in your decision. The data table feature of Excel does exactly that.
Full article: Data tables
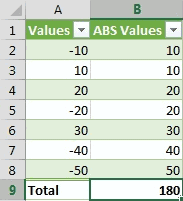
A colleague of mine asked me today how to go about using MS Excel formulas to calculate the sum of absolute values from a given dataset. This question crops up quite often on the forums so I thought I'd put together a quick blog post on it.
There isn't a built-in SUMABS() (or equivalent) worksheet function so you have to do a little bit of work to get the right answer.
Three options:
- Use a helper column.
- Use a
SUM()array formula orSUMPRODUCT(). - Use
SUMIF().
Full article: Calculate the absolute sum in Excel