
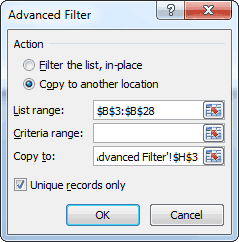
Today we will see how to get the unique values from an Excel list/range using three different methods:
- Removing duplicates.
- Using advanced filter.
- Using array formula(s).
The sequence of the methods corresponds to the degree of difficulty, implying that the method of array formula is probably the most difficult to implement.
Full article: Get the unique values from an Excel list
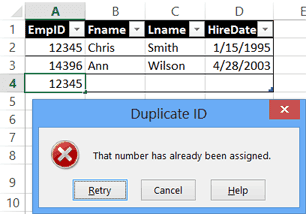
Data validation is a great feature in Excel, and I often use it to create a drop down list in a cell. That helps prevent data entry errors, and limits what people can input.
You can use data validation rules in other ways too. For example, you can prevent duplicate entries in an range or cells, or in a table column.
In this example, employee data is being entered in a formatted table, and each employee must have a unique ID number. The COUNTIF function can check the cells for identical entries, and warn you, or stop you, if an ID number is already in use.
Full article: Block duplicate entries in Excel table
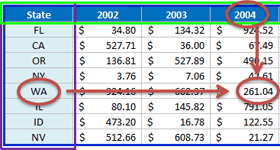
If you're using Excel and you've already learned how to use INDEX MATCH, you're well on your way to becoming proficient with Excel lookups. What INDEX MATCH MATCH offers you is a more powerful version of the formula.
Instead of just a vertical lookup, INDEX MATCH MATCH allows you to perform a matrix lookup, which is also known as a two-way lookup. This combination formula may initially seem complex because of its three individual formulas, but after you understand each component and how they interact, using this tool will become second nature to you.
INDEX MATCH MATCH is one of several lookup formulas you should learn to become adept in database theory.
Full article: How to use INDEX MATCH MATCH
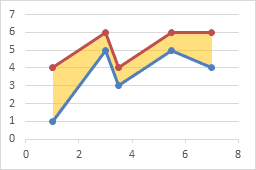
Shading between plotted lines with a light color can enhance some charts. The shading may help to indicate a target range for the data.
I've written earlier tutorials about this topic, but I have had to change sequences of steps in the protocol because more recent versions of Excel were not as flexible with order of operations as Excel 2003.
Full article: Fill under or between series in an Excel XY chart

I was reading Contextures post about duplicate entries. In it, she creates a named range that refers to a Table column. That named range will expand and contract as the Table does. Tables have their own built-in names and they are so handy that I find myself using Tables whenever possible.
One of my favorite uses of Table references is using them in VLOOKUP. The third argument to VLOOKUP is the column from which to pull. I've never been a fan of making that dynamic. Instead, I would hard code the number and change it if the columns change. But with Table references, I find myself making that argument dynamic. It's a little less error prone, a lot more self-documenting, and while it's more typing, I don't have to count columns.
Full article: Naming Table columns
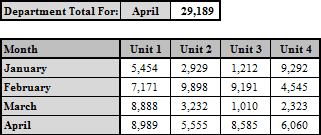
Using Named Ranges in your work in Excel is a highly recommended Best Practice. A problem may arise when trying to refer a Named Range, however. The solution is mastering the easy-to-use Indirect Function!
Using the Indirect Function, along with Validation, is an easy way to make a truly powerful interactive report.
Full article: Indirectly to the point
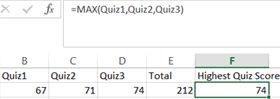
Cell referencing by name means that you use meaningful names to reference cells in formulas. The resulting formulas are easier to understand and names provide an immediate meaning to the calculation being performed by the formula.
By default, names use absolute referencing. In some usages, absolute referencing may produce unexpected results; however, you can correct such results by using Name Manager to modify the referencing mode.
Full article: Cell referencing by name
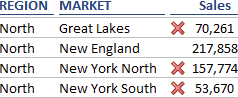
When applying Conditional Formatting, you may have situations where you don't want to apply your rule to certain cells in a range.
Excel provides a clever Conditional Formatting mechanism called "Stop If True". This allows you to specify when Excel should stop evaluating/formatting values if a condition is true.
Full article: Using Stop If True when Conditional Formatting
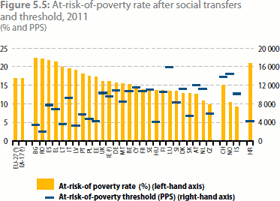
Pies charts are fun to use, but it's almost impossible for grown-ups to find a good reason for using them at work. So your first, safe-for-work choice is a bar chart. The boring bar chart. I don’t like bar charts.
So, here are some reasons why I don't like bar charts:
- Have to be sorted.
- Very low data density (inefficient encoding).
- Very sensitive to scale breaks.
- Forces you to use color.
- Feels cluttered.
- Accepts very few data points.
- It's difficult to compare data points in a stacked bar.
- The second axis can be misleading.
Full article: Why I don't like bar charts