

Back to basics today, and a look at some Leading Best Practices for organizing your data and laying out your Excel workbooks:
- Data on one worksheet; information on another worksheet.
- No blank rows.
- Deconstruct your data.
- Format your headings.
- Sort your data.
- Columns are for fields.
Full article: Layout best practices
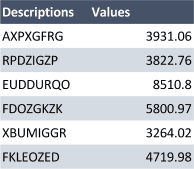
Scrub your data in VBA using Regular Expressions (RegExp).
A Regular Expression is a sequence of characters that create a pattern. The sequence could be something complicated like <([A-Z][A-Z0-9]*)\b[^>]*<(.*?) to something simple like \d.
Regular Expressions are very useful in VBA for working with many different scenarios of strings and introducing automation for transforming your data before loading to target databases for OLAP such as Essbase, Power Pivot or SSAS.
Full article: Scrub your data expressively
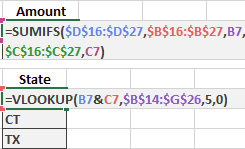
If you have ever tried to use a VLOOKUP function with two or more criteria columns, you've quickly discovered that it just wasn't built for that purpose. Fortunately, there is another function that may work as an alternative to VLOOKUP depending on what you want to return:
SUMIFS. Perform multi-column lookups when the return value is numeric.VLOOKUPandCONCATENATE. Perform multi-column lookups when the return value is a text string.
Full article: VLOOKUP on two or more criteria columns
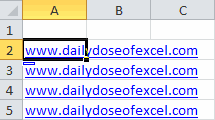
Cells can contain two types of hyperlinks. There's the embedded kind that you create using Insert – Hyperlink and the formula kind that you create using the HYPERLINK function.
Excel does not stop you from entering a HYPERLINK formula in a cell with an embedded hyperlink. If you do, you can end up with what seems like two hyperlinks in one cell.
I say "seems like" because Excel only recognizes one. And to be even more precise, it recognizes pieces of both hyperlinks to make one.
Full article: The duality of hyperlinks
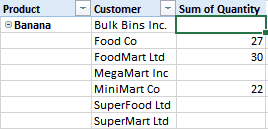
A pivot table is a great way to see a summary of sales to your customers. You can see how much they bought, and how much they spent, on each product.
But, by default, pivot tables don't show missing data. By making changes to the pivot table, you can easily spot the missing products for each customer:
- Option 1: Change the pivot table layout.
- Option 2: Show all items.
- Option 3: Show only the customers with no purchases.
Full article: Pivot Table shows customers with no purchases
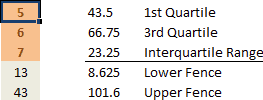
When performing data analysis, we assume our values cluster around some central data point (a median). But sometimes, a few of the values fall too far from the central point – skewing the analysis. These values are called outliers.
In this example we apply the Tukey method for highlighting outliers in a data set.
Full article: Highlighting outliers in your data with the Tukey method
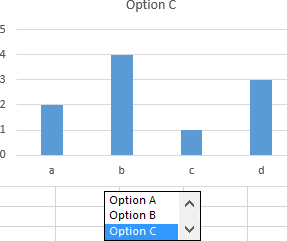
If you're making a dashboard-style report in Excel, you may prefer that a chart not be cluttered with all of the available data, but instead allow the report consumer select which set of data to analyze.
This post shows you how to create simple interactive charts in Excel, using the built-in list and option controls.
Full article: Simple interactive charts in Excel

The File System Object (FSO) provides access to a computer's file system. The particular object contains 3 object collections, 4 other objects, as well as several properties and methods.
This post focuses on accessing three useful properties of the File System Object using VBA:
- Drive Exists.
- Folder Exists.
- File Exists.
Full article: Determine the drive, folder & file existence (VBA functions)
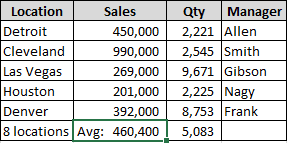
Sometimes you need to label the result of a function, but have no where to add it. Here's an option: Include the label in a custom number format. This article shows you how.
Full article: Where do I put the label?