
10 September 2013
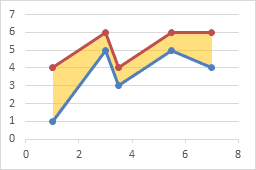
Shading between plotted lines with a light color can enhance some charts. The shading may help to indicate a target range for the data.
I've written earlier tutorials about this topic, but I have had to change sequences of steps in the protocol because more recent versions of Excel were not as flexible with order of operations as Excel 2003.
Full article: Fill under or between series in an Excel XY chart