Authors
Andrea Kohlhase & Alexandru Toader
Abstract
Spreadsheets are well-known to be frequently-used but error-prone communication devices. They are useful since they are active (e.g., automatic computation), provide a cognitive notation system drawing on visualizing values, meanings and relations at the same time (enabled by labeled, color-coded grids), and provide easy-to-use domain-specific operations (e.g., computational functions). The latter, in particular, is enabled by the text-style formula format in spreadsheets, in which variables are replaced by cell references.
For simply-structured formulae this works very well. To keep the formulae simple, computations are modularized into subformulae and as such distributed over and beyond the spreadsheet. This makes the provenance (tree) of spreadsheet values difficult to understand – a probable cause for the high error rate in spreadsheets.
To explore and navigate the subformulae involved in the computation of a cell value we present the subformula explorer "Fency", a tree-based, explorative interface: Whenever a user clicks on a cell its formula becomes the root of a cell-dependency graph. Each child node displays the formula of a cell (or range) reference used in the parent formula. Moreover, each node represents a direct link to the respective cell (or range), so that it can be used for formula navigation as well.
Sample

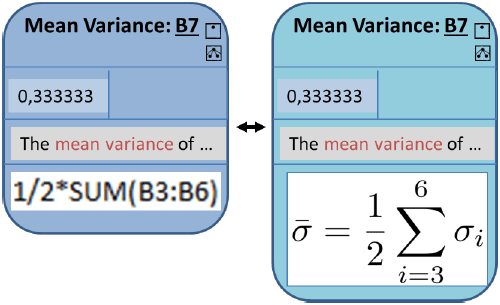
Fency offers a tree-based visualization of the formulae in a spreadsheet. Every node of the formula graph consists of a list of elements:
- A title expressing the underlying meaning of a cell.
- A link to the corresponding cell/range in the spreadsheet.
- The dependencies this cell/range depends on.
- Its data value.
- An explanation of its meaning.
- The spreadsheet formula (or its equivalent math formula).
- Iterators to move through the cells.
Publication
2013, LWA 2013, October
