

Guidelines:
- Content flows logically from top-left to bottom-right
- Keep related content close together
- Prefer having a short arc of precedence
- Highlight deviations from the general flow
Ensure that a worksheet's content flows in a logical manner, to make it easy to understand and change.
Top-left to bottom-right: Like English documents
In general, worksheets should flow from the top-left to the bottom-right, reflecting the convention for English language documents.
This convention also reflects the way that Excel arranges references. Excel will arrange a reference to cells in top-left to bottom-right order irrespective of the order in which you specified them. For example, if you type a formula as =SUM(C20:A1), then Excel will change it to be =SUM(A1:C20).
Keep it close
Keeping related content close together reduces the complexity of logic flows through a spreadsheet, enabling easier understanding. This applies to all sorts of content, such as charts, not just formulae.
For example, it is easier to see the relationship between cells that reference adjacent cells (i.e., have a short arc of precedence). Conversely, when deciphering the references in a formula, multiple arcs of precedence that go off screen – especially to other worksheets or workbooks – are especially difficult to understand.
Highlight deviations
Deviations from the top-left to bottom-right convention require a good reason. For example, a common structure in financial models has the beginning balance at the top of one column depending on the ending balance at the bottom of the previous column. This is known as a corkscrew structure. Like other situations where a formula is inconsistent with those adjacent, it is helpful to highlight the inconsistencies.
Example of good flow
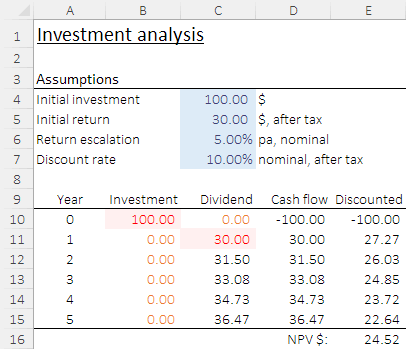
This image shows an example investment analysis spreadsheet that has good flow.
It starts with a heading in cell A1. Below the heading is a block of assumptions. These assumptions are presented in an order that reflects the order in which they are used in the model, with related items together. Alternatively, an order that reflects user expectations would also be OK.
The model block A9:E16 also flows from top-left to bottom-right, reflecting the logic of the situation:
- In the first column we have the Year labels.
- The next column has the investment amounts, starting with the initial investment. The other cells have hard-coded zero values to avoid formulae referencing empty cells. These differences are highlighted.
- Next we have the Dividend, which flows down the years. Again, we highlight the cells that don't follow the general pattern in that column.
- The cash flow calculation follows the Investment and Dividend columns, which it refers to.
- Then we calculate the discounted cash flow column.
- Finally, the NPV calculation is at the bottom-right of block.
Example of bad flow

There are many ways in which the investment analysis spreadsheet could be structured. This image is an example of the same spreadsheet presented in a different order:
- We start with a heading in A1, which is good.
- We then have some, but not all, of the assumptions.
- The NPV result is presented next. There might be a good reason to present the result near the top – especially if it would be off-screen due to the number of rows in the cash flow calculations. However, in this case, the NPV is above the cash flow column, which may imply significance that does not exist and might be misleading.
- In the model block, the columns have an illogical order. The cash flow column is to the left of the dividend column, even though the dividend in included in the cash flow. The cash flow is also separated from the discounted column, despite the discounted values logically directly following the cash flows.
- Finally, some of the other assumptions are embedded in the calculations. Sometimes that can be OK. But, in this case, it does not make sense to jump all over the spreadsheet to fill in the required assumptions.
This logic flow is confusing, making the spreadsheet harder to understand. It is also likely to lead to errors if changes are made to the spreadsheet.