11 July 2015
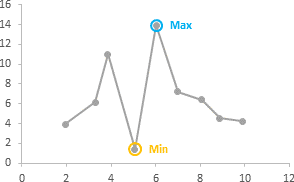
This article shows you how to automatically highlight the minimum and maximum points in a chart. Using an automated approach avoids the problems associated with manually highlighting chart data.
This approach, of adding a series for any data you want to highlight, is very flexible. You don't need to only highlight minimum or maximum values, you can highlight anything that you can write a formula for.
Full article: Highlight min and max data points in an Excel chart