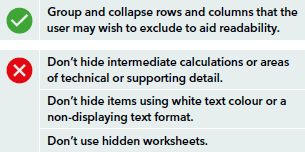
Financial models are often built ad hoc or without due planning, care and attention, and stories of faulty financial models are common.
ICAEW has created this financial modelling code to provide essential guidance to standard-setters, procurers and modellers on good practice. The guidance is principles-based, high-level and broadly accepted.
The code is divided into the following sections:
- Model definition and purpose.
- Layout and structure.
- User interface and transparency.
- Consistency.
- Clarity.
- Error reduction.
- Calculation techniques.
Full article: Financial Modelling Code
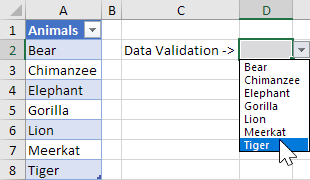
Excel Tables expand automatically whenever new data is added to the bottom. Data Validation lists would benefit from the auto-expand feature… but it just doesn't work.
This article shows you how to make a Data Validation list that refers to a Table, via three methods:
- Normal cell references over a Table.
- Named Range of the Table column.
INDIRECTfunction.
Full article: Using an Excel Table within a Data Validation list

Comprehensive list of things that you can do with Power Query.
Excel Power Query is one of the most powerful new features within Microsoft Excel and the easiest to learn.
You can use Power Query to clean & transform your data that you download from your ERP or accounting system and display it in a report for Excel to work with.
The best thing is that you can reapply the same transformation steps in just ONE single click, saving you HOURS! So next week when you get the same report with updated data, a simple REFRESH will transform your data once again!
As of October 2018, this interactive tutorial continues to be expanded, with 33 of the 50 topics completed. New topics are being added.
Full article: 50 things you can do with Excel Power Query
New features coming to Excel soon.
Until now, you wrote a formula for each value you wanted returned to the grid. One formula, one value. If you wanted another value, you wrote (or copied) another formula.
With dynamic arrays, that all changes.
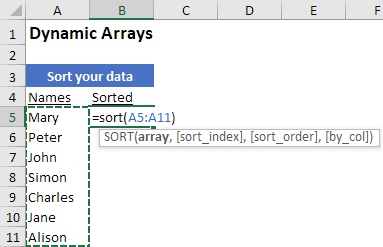
Now, you can write a formula, hit the enter key, and get an array of values returned. One formula, many values. This will allow you to build more capable spreadsheets, faster, with fewer formulas and less chance of error.
Here is the full set of functions that will be accompanying dynamic arrays:
- FILTER Filters an array of data based on criteria you define.
- UNIQUE Returns a list of unique values from a list or range.
- SORT Sorts an array of values.
- SORTBY Sorts an array based on a corresponding array.
- SEQUENCE Generates a list of sequential numbers, such as 1, 2, 3, 4.
SINGLE Accepts a range or array and returns a single value using implicit intersection.(Superseded)- RANDARRAY Returns an array of random numbers between 0 and 1.
For more information, also see Mr. Excel: Major calc engine change.
Full article: Preview of dynamic arrays in Excel
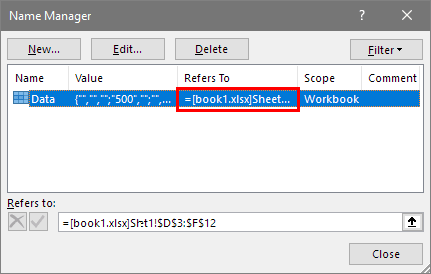
So you're on a mission to remove external links from your Excel workbook, huh?
Seems like it should be easy, but as you are probably finding out, it sometimes isn't as easy as clicking the "break links" button (unfortunately).
This post walks you through all the hiding places that external links may be lurking, including:
- Cells.
- Charts.
- Shapes.
- Names ranges.
- Pivot Tables.
- Data Validation.
Full article: The guide to finding and removing external links from your Excel file
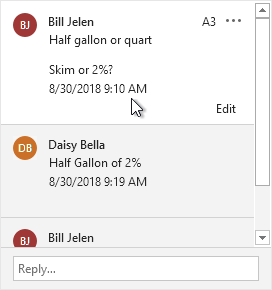
Excel 365 is getting a new cell comments system.
This video from Bill Jenen (AKA Mr. Excel) introduces the new system, highlighting the new features and providing advice about how and when to keep the old system.
Contents:
- Threaded comments are cool!
- Old and new comments can co-exist.
- Why to keep legacy comments.
- Converting to threaded comments is permanent.
- How to use legacy comments.
- New comment VBA.

The old style of comments, called "Notes", have been restored to the Review ribbon next to the new "Comments" group.
Full article: Excel threaded comments: The good and the ugly
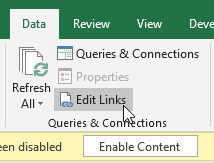
This article considers the dreaded "phantom link".
That is, Excel displays the security warning "Automatic update of links has been disabled", even though your spreadsheet isn't intended to have any links.
Learn how to easily find and remove phantom links.
Full article: Phantom links
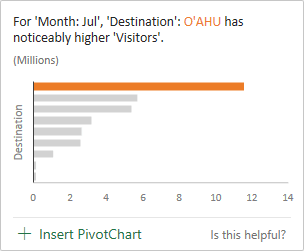
Excel Insights is an AI powered service that automatically identifies patterns in your data and provides you with charts you can insert into your workbook.
This article provides an introduction to the features of AI Insights, including the four insight classes:
- Trends.
- Rank.
- Majority.
- Outliers.
Full article: Excel Insights
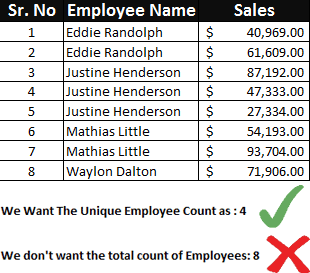
A very common requirement is to count only the unique occurrences of some values. But Excel doesn't have a direct way to count unique values.
In this post we show 5 different ways of counting unique values in Excel:
SUMPRODUCTandCOUNTIFSUM,FREQUENCYandMATCHarray formula- PivotTable
SUMandCOUNTIFCOUNTUNIQUEuser defined function
Full article: Counting unique values in Excel – 5 effective ways
