Authors
Daniel W. Barowy
Abstract
Spreadsheets are a natural fit for data analysis, combining a simple data storage and presentation layer with a programming language and basic debugging tools.
Because spreadsheets are accessible and flexible, they are used by both novices and experts. Consequently, spreadsheets are hugely popular, with more than 750 million copies of Microsoft Excel installed worldwide. This popularity means that spreadsheets are the most popular programming language on the planet and the de facto tool for data analysis.
Nevertheless, spreadsheets do not address a number of important tasks in a typical analyst's pipeline, and their design frequently complicates them. This thesis describes three key challenges for analysts using spreadsheets:
- 1) Data wrangling is the process of converting or mapping data from a "raw" form into another form suitable for use with automated tools.
- 2) Data cleaning is the process of locating and correcting omitted or erroneous data.
- 3) Formula auditing is the process of finding and correcting spreadsheet program errors.
These three tasks combined are estimated to occupy more than three quarters of a data analyst's time. Furthermore, errors not caught during these steps have led to catastrophically bad decisions resulting in billions of dollars in losses. Advances in automated techniques for these tasks may result in dramatic savings in both time and money.
Three novel programming language-based techniques were created to address these key tasks:
- The first, automatic layout transformation using examples, is a program synthesis-based technique that lets spreadsheet users perform data wrangling tasks automatically, at scale, and without programming.
- The second, data debugging, is technique for data cleaning that combines program analysis and statistical analysis to automatically find likely data errors.
- The third, spatio-structural program analysis unifies positional and dependence information and finds spreadsheet errors using a kind of anomaly analysis.
Each technique was implemented as an end-user tool - FlashRelate, CheckCell, and ExceLint respectively - in the form of a point-and-click plugin for Microsoft Excel. Our evaluation demonstrates that these techniques substantially improve user efficiency.
Finally, because these tools build on each other in a complementary fashion, data analysts can run data wrangling, cleaning, and formula auditing tasks together in a single analysis pipeline.
Sample

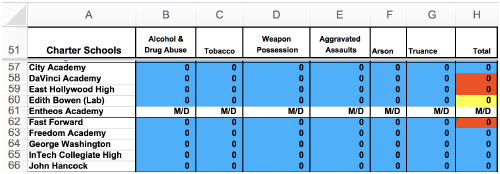
This figure shows ExceLint's regularity map visualization, which is built on top of spatio-structural analysis.
It is immediately apparent that something is unusual with the cells in column H. First, cell H57 is colored blue, which indicates that it is data like the cells found to its left. In fact, this cell should be a formula.
Cells H58, H59, and H62 stand out because they are colored orange. All of these cells exhibit an off-by-one reference error that instead computes the row total for the row one below.
Finally, cell H60 is colored yellow. This cell exhibits an off-by-two reference error that computes the row total for the row two cells below.
When using the regularity map visualization, all of these problems immediately "pop out."
Publication
2017, Ph.D thesis, University of Massachusetts Amherst, Doctoral Dissertations, 1045, September
