Authors
Daniel Kulesz, Jonas Scheurich, & Fabian Beck
Abstract
Although spreadsheets are often faulty, end-users like them for their flexibility. Most existing approaches to spreadsheet diagnosis are fully automated and use static analysis techniques to find anomalies in formulas or methods to derive test cases without user interaction. The few more interactive approaches are based on values already present in spreadsheets as well.
In our work, we advance the idea of testing spreadsheets with user-defined test scenarios but encourage visually aided creation of independent test cases by separating the definition of test scenarios from the specific values present in the spreadsheet — just like test code is separated from production code in professional software.
We combine the testing approach with static analysis and integrate it into a common visual spreadsheet environment named SIFEI. It supports users in interactively creating, executing, and analyzing their own test scenarios with a number of visual markers. Findings from two qualitative studies indicate that the concept is suitable for casual spreadsheet users.
Sample

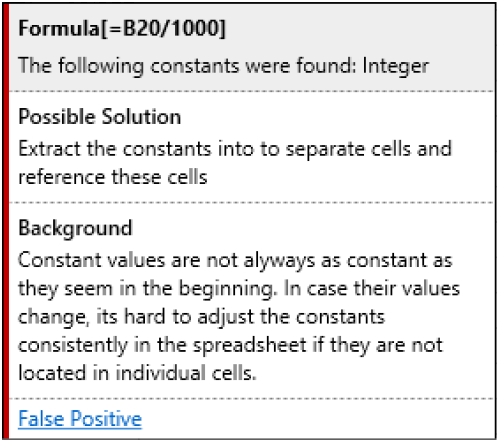
We implemented an Excel tool called Spreadsheet Inspection Framework Excel Integration (SIFEI) which adds: a ribbon bar, a list of findings in a side pane, markers highlighting cells with findings, and tooltip dialogs with further explanations of findings.
Publication
2014, 2nd IEEE Working Conference on Software Visualization, September
Full article
Integrating anomaly diagnosis techniques into spreadsheet environments
