Authors
Bennett Kankuzi & Yirsaw Ayalew
Abstract
One of the difficulties in understanding and debugging spreadsheets is due to the invisibility of the data flow structure which is associated with cell formulas. In this paper, we present a spreadsheet visualization approach that is mainly based on the Markov Clustering (MCL) algorithm in an attempt to help spreadsheet users understand and debug their spreadsheets.
The MCL algorithm helps in visualizing large graphs by generating clusters of cells. In our visualization approach, we also use compound fisheye views and treemaps to help in the navigation of the generated clusters. Compound fish eye views help to view members of a particular cluster while showing their linkages with other clusters. Treemaps help to visualize the depth we are at while navigating a cluster tree.
Our initial experiments show that graph-based spreadsheet visualization using the MCL algorithm generates clusters which match with the corresponding logical areas of a given spreadsheet. Our experiments also show that analysis of the clusters helps us to identify some errors in the spreadsheets.
Sample

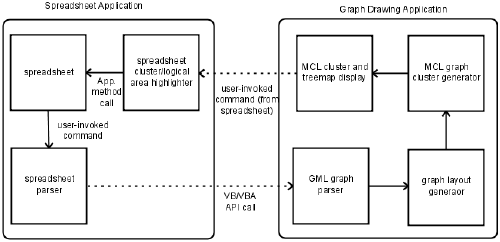
We developed a prototype tool with this conceptual architecture.
The parser has been developed using VBA, which iterates through all used formula cells to extract cell-dependency information using the precedent cells of a given formula cell.
The extracted dependency information is written to a text file in the GML file format while we are iterating.
Thereafter, a Java-based graphdrawing program (i.e., Graphael) is invoked to display the resulting graph.
Publication
2008, 4th international workshop on end-user software engineering, May, Pages 86-90
Full article
An end-user oriented graph-based visualization for spreadsheets
