Authors
Yirsaw Ayalew
Abstract
Spreadsheet programs, artefacts developed by end-user programmers, are used for a variety of important tasks and decisions. However, as the literature indicates, a significant proportion of spreadsheet programs contain faults.
One of the contributing factors to the quality issue is the invisibility of cell dependencies (which define the dataflow structure of a spreadsheet) upon which computations are performed.
In an attempt to provide a guide in understanding spreadsheets, this paper presents an approach to visualize a spreadsheet in terms of logical areas using the MCL (Markov Clustering) algorithm. Instead of focusing their attention on the whole spreadsheet, spreadsheet users may narrow their focus to one logical area at a time.
To evaluate our approach, a prototype tool has been developed and integrated into Microsoft Excel.
Sample

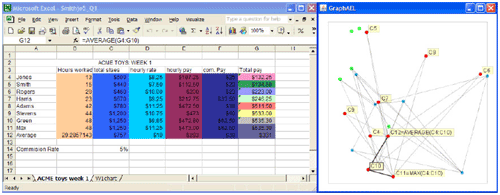
Clusters of cells are generated using the Markov Clustering (MCL) algorithm and then visualized in a Graphael program window side by side with the spreadsheet.
Publication
2009, Warm-up workshop for ACM/IEEE ICSE 2010, April, pages 13-16
Full article
A visualization-based approach for improving spreadsheet quality
