Authors
Bennett Kankuzi
Abstract
Spreadsheet systems are widely used and highly popular end-user systems. They are highly popular because of the simplicity with which one can create spreadsheets. However, despite this simplicity in creating spreadsheets, they are generally difficult to understand and comprehend.
The need for understanding spreadsheets arises when one wants to debug a spreadsheet as well when one wants to maintain or even just to understand a spreadsheet created by others. One contributing factor to the difficulty in understanding spreadsheets is due to the invisibility of the data dependencies which are associated with cell formulas.
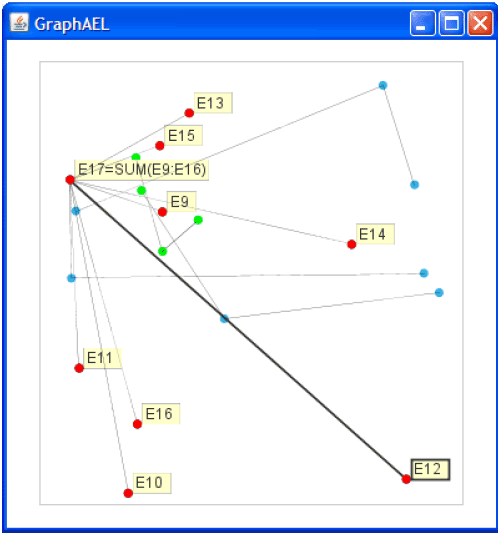
This research work aims to provide a graph-based visualization approach that can simplify understanding and debugging of spreadsheets based on the MCL (Markov Clustering) algorithm. The MCL algorithm helps in visualizing spreadsheet dataflow graphs by generating clusters of cells.
Navigation through graph clusters is provided through complementary techniques of compound fisheye views and treemaps. More importantly, our experiments show that graph based visualization using the MCL algorithm generates clusters which match with corresponding logical areas of a spreadsheet.
Identified MCL clusters are then dynamically highlighted in the original spreadsheet using different cell background colours. Hence instead of looking at the whole spreadsheet at once, the user focusses his/her attention at each highlighted logical area at a time. The spreadsheet comprehension process is therefore properly guided since the focus area matches with what the user might perceive to be a logical unit.
Sample

Spreadsheet dependencies are extracted through a process of rowwise iteration through all used spreadsheet cells.
The Markov clustering (MCL) algorithm is run to produce the required graph clusters.
The clusters are displayed by organizing them in a cluster tree. The leaves of the cluster tree are nodes (cells) of a particular cluster.
The top-most level view of the cluster tree is a single node. A cluster tree is displayed at different levels in the cluster display window.
Publication
2008, Master's thesis, University of Botswana, June
Full article
A dynamic graph-based visualization for spreadsheets
Also see
Proceedings of Conference on Human Computer Interaction, 2008
